Speed management: Why is speed such a crucial, yet often underestimated, road safety issue?
Speed management is a foundational pillar of improving road safety, including far-reaching impacts on public health, livability, and the urban environment.
Introduction
Speed management is a foundational pillar of improving road safety, including far-reaching impacts on public health, livability, and the urban environment. It features prominently in the UN‘s strategic plan for Decade of Action for Road Safety 2021-2030 and is a crucial theme in the Sustainable Development Goals (i.e. SDG 3.6), both of which aim to cut global road safety deaths and serious injuries by 2030.
The relationships between vehicle speed, crash frequency, and injury severity are governed by physical laws and firmly supported by extensive empirical research. Even minor reductions in average speed deliver outsized improvements to safety outcomes, particularly for vulnerable road users. Yet, speeding is ubiquitous and most drivers see little harm in limited speeding.
This article provides key evidence, policy recommendations and references across enforcement, infrastructure design and publicity lines and argues for comprehensive speed management strategies to protect vulnerable road users (VRUs), to enhance urban livability and to reduce both crash frequency and severity and improve road safety on risky secondary roads.
The physics of speed: Kinetic energy and impact severity
At the core of road safety is a fundamental principle of physics: kinetic energy increases exponentially with speed. The kinetic energy (KE) of a moving vehicle is given by:
KE = ½mv²
Where m is the mass of the vehicle and v is its velocity. Because the velocity is squared, small increases in average speed disproportionately magnify the energy in crashes and thus the severity of its outcomes (Source 3). For instance, increasing speed from 50 km/h to 60 km/h results in a 44% increase in kinetic energy, dramatically worsening potential crash outcomes. Decreasing the speed from 50km/h to 30 km/h reduces the amount of kinetic energy of a crash by a whopping 64%, which explains policies which reduce central city and residential speed limits to 30 km/h.
Reaction times and longer stopping distances
As a consequence of the above formulae higher speeds disproportionately increase stopping distances. These are affected by both reaction time and braking distance (Source 4):
- Increased reaction distance: how far a vehicle travels before the driver begins to respond. This factor increases linearly with speed.
- Longer braking distance: Vehicles travel farther during braking at higher speeds (Source 5) and by contrast, this factor increases proportionally to the square of speed: doubling speed quadruples the distance needed to stop when braking.
For example, at 50 km/h, a vehicle’s braking distance is approximately 13 meters; at 60 km/h, this increases to 18 meters—a 38% rise for just a 10 km/h increase (Source 6). A car traveling at 30 km/h on dry surface stops in 14 meters, at 50km/h in 28 meters, at 100 km/h in 80 meters and at 130 km/h in 124 meters (Source 7).
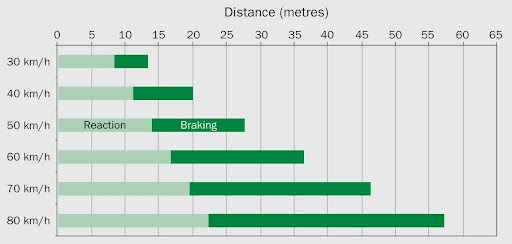
Figure 3 - Stopping distances in an emergency - Source: Speed management: a road safety manual for decision-makers and practitioners. Geneva, Global Road Safety Partnership, 2008 (Source 8)
Based on the above, when average road network speeds increase by only a bit, the frequency of crashes also increases, since vehicles fail to stop in time to avoid a collision. This non-linear dynamic means higher speeds erode the ability to stop in time or to avoid hazards, especially when conditions such as wet roads or poor tires come into play. Higher speeds leave less margin for error, making even minor misjudgments or distractions potentially fatal. This concept is shown in this excellent road safety publicity advert against speeding from New Zealand: 'Mistakes' (New Zealand road safety advert)
Small speed changes, big road safety gains
Even slight increases in the average network wide speed have an excessive impact on road safety. The European Transport Safety Council (ETSC) reports that a 1 km/h decrease in average speed can prevent approximately 2100 deaths per year across the EU (Source 9). This equals almost one-tenth of the annual EU death count in 2019 (Source 10).
This is far more than can be expected from the Power Model by Göran Nilsson (Source 11) which also relates average network speed of vehicles to crash frequency and severity and states that:
- A 1% increase in average speed leads to about a 2% increase in injury accidents and a 4% increase in fatal accidents.
- Conversely, a 1% decrease in average speed leads to about a 2% decrease in injury accidents and a 4% decrease in fatal accidents.
What is clear is that small decreases in the average speed of vehicles on a road network have an outsized effect on improving road safety statistics. It is no surprise therefore, that the World Health Organization (WHO) highlights speed management as one of the most effective tools for improving road safety outcomes worldwide.
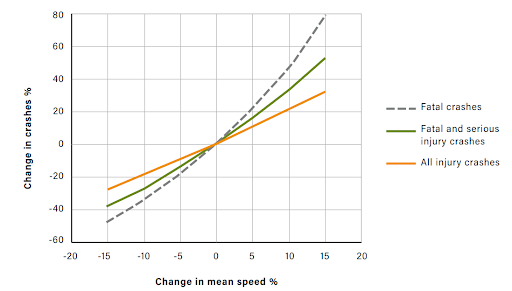
Figure 1. Relationship between percentage change in mean speed and the percentage change in crashes (Source: WHO Speed Management, Second Edition) (Source 12)
Tragedy of the Commons: Individual speeding harms collective road safety and communities
The fact that drivers continue to speed despite the higher risks to the community at large and also to themselves and their passengers is a classic ‘tragedy of the commons’. It occurs when individual drivers prioritize minor time savings, benefitting themselves, over collective safety. Many drivers perceive minor speeding—5–10 km/h over the limit—as harmless. While each driver may perceive minimal personal risk from “just a bit” of speeding, the cumulative effect raises the total amount of energy within the road transport system, thus increasing the risk, frequency and severity of crashes and negatively affecting road and community safety. This is a serious negative externality for a community, neighbourhood or city, especially if this is done by a large part of the driving public. Conversely, attaining small average speed reductions by enforcement or other speed management instruments, yield significant road safety and quality of life benefits for the community as shown in the previous paragraph.
Overconfidence in driving skills and the illusion of control
Many drivers overestimate their ability to control vehicles at high speeds, a cognitive bias known as the "illusion of control" (Source 13). This overconfidence leads to:
- Speeding
- Underestimation of braking distances
- Misjudgment of VRU presence and their intentions
- Increased risk-taking, e.g. in curves, overtaking on secondary roads
This illusion ignores fundamental physics and empirical evidence. Studies underline that speed is both a contributory and an aggravating factor in the vast majority of crashes; it not only increases the likelihood of a collision but also multiplies the severity of its consequences.
Many drivers overestimate their ability to handle high speeds, believing that skill or experience can compensate for the physical and psychological limitations of human perception and reaction time. They assume that higher speeds are manageable and do not believe it endangers themselves or their passengers, let alone aggregate road safety. This cognitive bias contributes to risky behaviours and undercuts the effectiveness of voluntary compliance with speed limits. Real-world driving conditions—unpredictable VRUs (e.g. cyclists, pedestrians), variable road surfaces and other drivers' actions (e.g. distracted or drink driving) —cannot be reliably "managed" by individual skill alone.

Additionally, a large body of research indicates that a significant majority of drivers - typically between 70% and 93% (Source 15) - believe they are better than average drivers. Obviously, this is mathematically impossible. The phenomenon is often referred to as the "better-than-average effect" or "illusory superiority." This perception of superior skill often legitimises speeding, the rationale being that the speed limit is set for drivers with average driving skills.
Speeding negatively affects urban livability
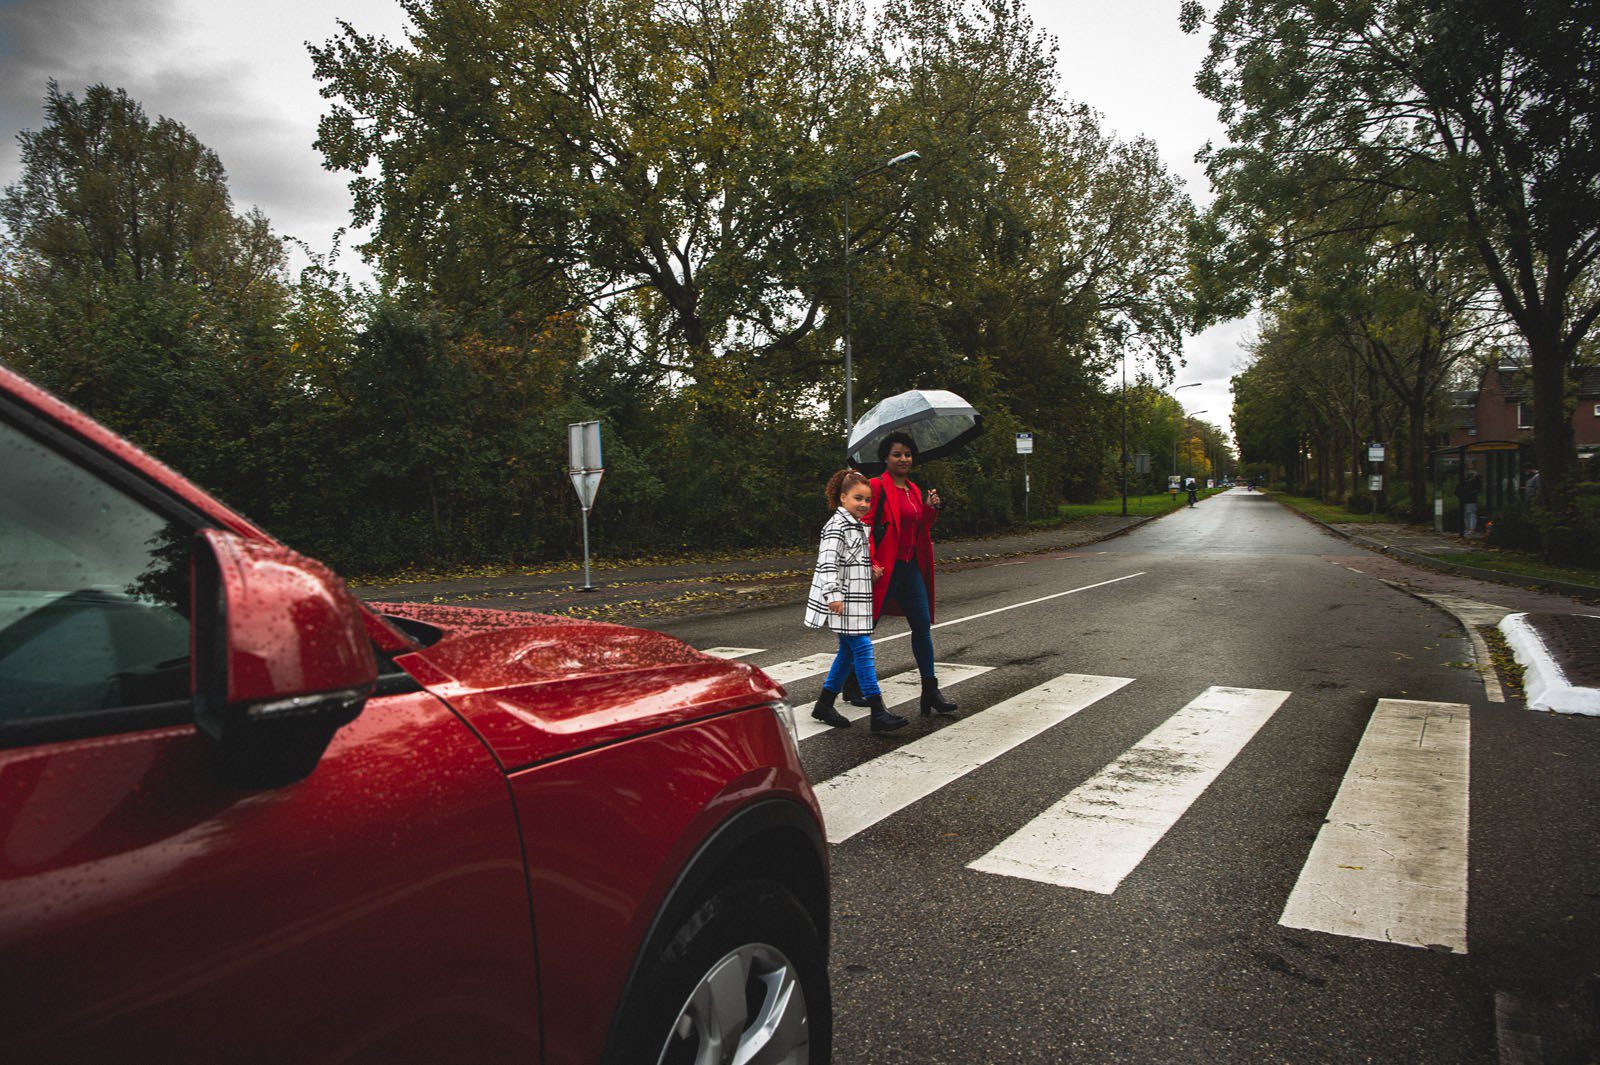
Speeding disproportionately endangers VRUs and public transport users. In the EU, pedestrians account for 21% of road fatalities, with speed identified as a critical factor in 30% of fatal crashes (Source 16). Higher speeds narrow the drivers’ field of vision, limit the ability to stop in time, and increase stopping distance, crash frequency and a higher risk of severe injury or death for VRUs (Source 17).
Moreover, excessive vehicle speeds harm urban livability by:
- Increasing noise and air pollution.
- Reducing the attractiveness of walking, cycling and the use of public transport.
- Fragmenting communities and the reach of public facilities due to high-speed corridors.
Higher speeds degrade urban quality of life and disproportionately endanger VRUs. Faster traffic also discourages active mobility (e.g. walking, jogging and cycling), reduces the attractiveness of public transport, and escalates the perceived risk by residents and their children for outdoor activities and recreation in the neighbourhood. Public transport use also declines when streets are dominated by fast-moving cars, further eroding urban livability. Lower vehicle speeds foster safer, more pleasant community spaces, directly benefiting local events, recreation, health, equity, and local air quality (Source 18).
Speeding often causes crashes and is aggravating crash severity in almost all cases
Speed is a primary cause in 30% of fatal crashes and a critically aggravating factor in nearly all collisions (Source 19). It can escalate what could be minor incidents into serious or fatal crash. Reducing speeds is thus not just a preventative measure—it is a mitigation strategy that reduces injury severity across all types of crashes. The probability of fatality for a pedestrian struck by a car increases from 10% at 30 km/h to 90% at 50 km/h (Source 20). This explains why the speed limit in many residential areas is lowered from 50 to 30 km/h. Increasingly cities also go for 30 km/h or 20 mph on all central area roads: Amsterdam, Brussels, Graz, Helsinki, London, Paris and all municipalities in Spain (Source 21). Results from a report by the City of Helsinki states that “a speed of 50 km/hr increases the risk of a pedestrian death almost eight-fold compared to 30 km/hr.” Introducing Zone 30 pays off for cities. Helsinki reported no road safety fatalities for one full calendar year in August 2025 (Source 22). The graph below shows the collision speed and probability of death.
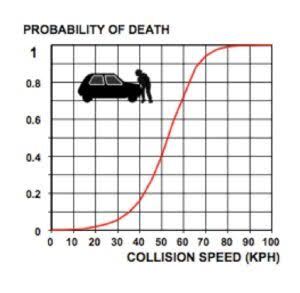
Figure 2. Relationship between Speed and Fatality Risk. Source: Helsinki City Planning Department, Finland (Source 23)
Amsterdam also saw a marked road safety improvement since the introduction of Zone 30. The number of accidents involving motor vehicles fell by 11% . Accidents between motor vehicles and VRUs decreased by 15%. Accidents involving trams and buses on 30 km/h roads dropped by 24%. Over 60% of drivers now comply with the speed limit (staying below 35 km/h), and the number of extreme speeders (over 55 km/h) has significantly decreased. The city also reported a reduction in traffic noise by an average of 1.5 decibels.
Additionally, the relationship between speed and the severity of a crash is very acute on secondary roads and intersections, where complexity and lack of separation seriously amplify risk and danger (Source 24).

Enforcement: Prioritizing Secondary Roads
Effective enforcement is pivotal, especially on high risk secondary road networks. These roads are disproportionately represented in crash statistics. They typically feature higher speed limits, numerous intersections, and a lack of physical dividers—conditions that increase complexity and exposure to high-severity crashes. A brief distraction by a smartphone could be fatal on these roads. Moreover, they often have limited visibility and mix various types of vehicles and road users including VRU. Speed checks and automated enforcement, such as cameras, have been shown to reduce violations and injuries, particularly in urban and semi-urban areas where risks are magnified by intersection density and proximity to pedestrians (Source 25). Manual and automated enforcement in these areas is essential to reduce risk and reinforce safe driving behaviour.

Communication and Awareness
Effective communication and public awareness are critical to the success of enforcement and other speed management measures aimed at improving road safety.
Here governments face a complex task. They have a nationwide objective of improving safety and health for their population and implement academic, evidence-based policies e.g. immunisation and tobacco control programmes. Similar to lower network speeds this high level objective clashes with the interests and opinions of individuals. Arguments include: ‘My grandfather smoked like a chimney and died naturally at 87’, ‘I am strong and eat healthy, never get sick and don’t need that vaccination’, ‘I always speed and never had an accident’. The only way for governments to bridge this disparity is by education and structured media-wide communication.
When new speed limits, infrastructure changes, or enforcement strategies are introduced, clear and proactive communication helps ensure that road users understand the reasons behind these changes and how they contribute to safer roads. Awareness campaigns can highlight the risks of speeding, the benefits of speed compliance, and the specific ways in which infrastructure—such as traffic calming features or redesigned intersections—supports safer speeds.
Governments could optimise the available communication methods. Speeding tickets can mention why enforcement is taking place on the road where the violation took place (e.g. 3 deadly crashes in the past 5 years), mention what the road safety effects of enforcement, roundabout or speed humps on speeding notices and in media. The allocation of traffic fines to fund road safety improvements, including road safety improving infrastructure upgrades, also helps to improve public support for enforcement, compared to the prevailing public notion that fines merely fill government coffers.
By fostering a shared understanding and encouraging public buy-in for speed management measures, communication efforts not only increase compliance with speed limits but also promote a broader culture of road safety, ultimately reducing crashes and saving lives.

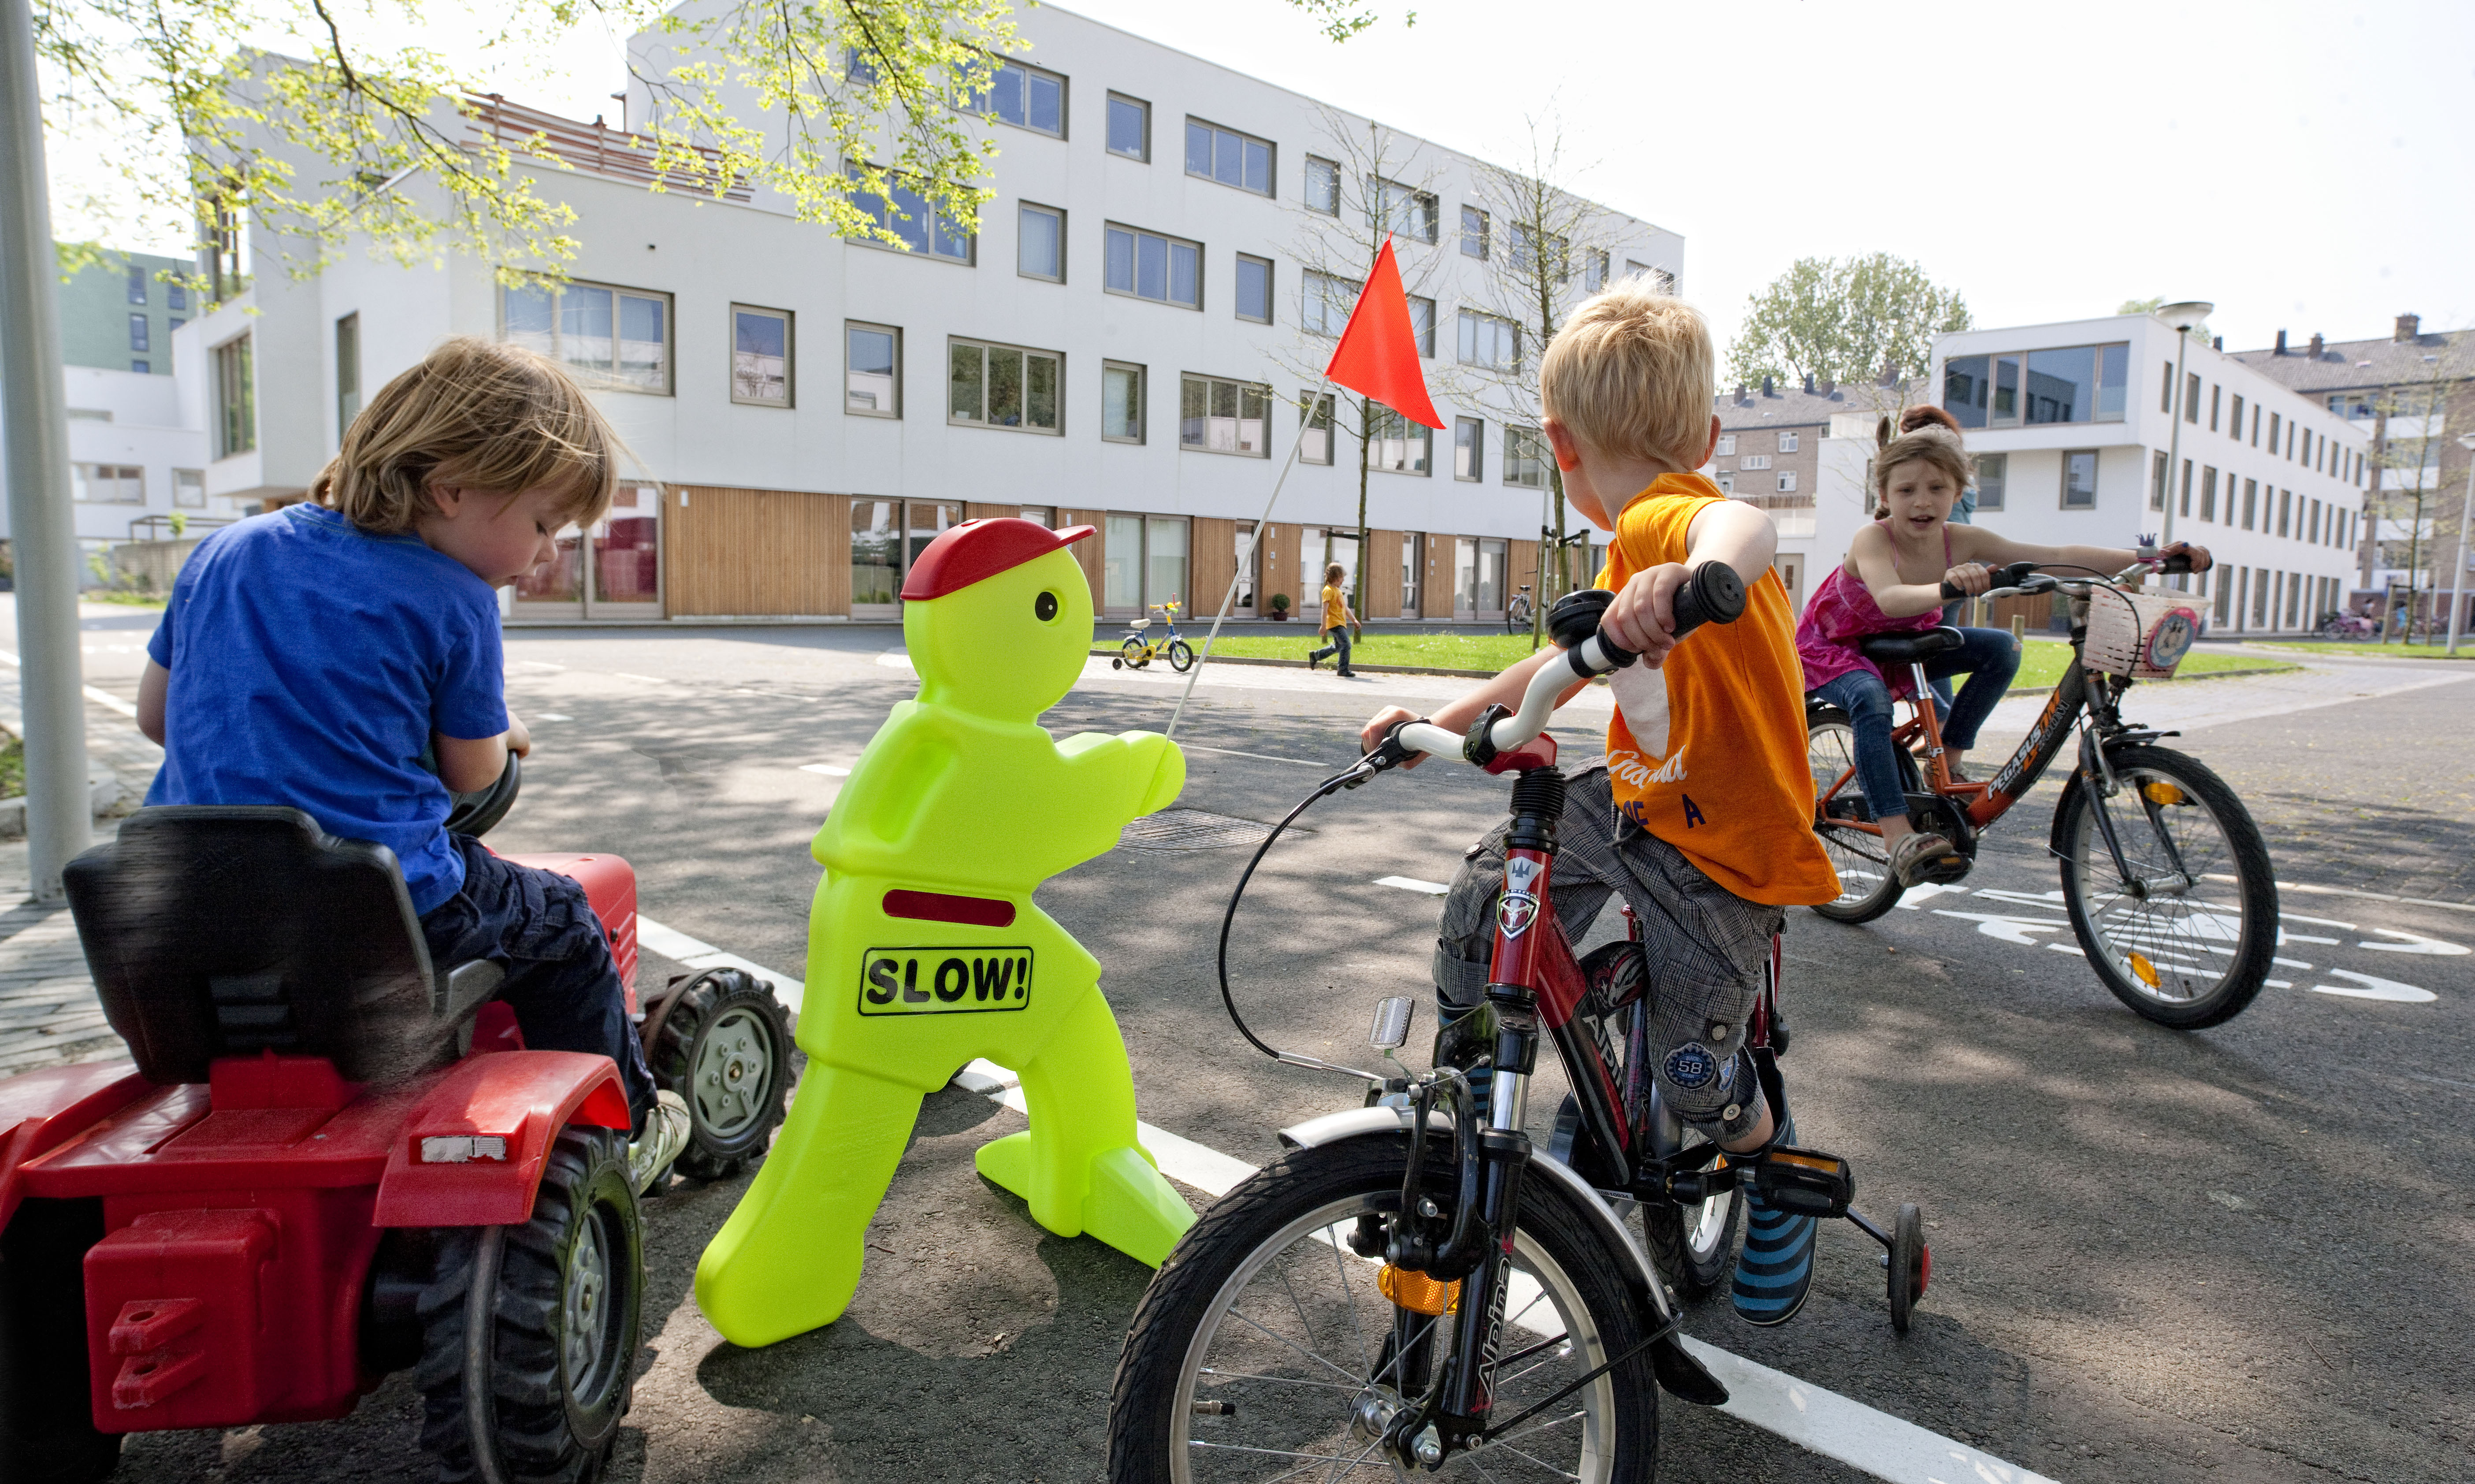
Figure 4: Source: New South Wales communication toolkit (Source 26)
Summary: Effective speed management requires a multi-pillar strategy
Speed management is important but to reap all the road safety benefits it needs to be firmly embedded in a multi-facetted approach along the following themes.
Traffic calming infrastructure adjustments:
- Designing roads to naturally calm traffic through predictable standardised layouts, narrower lanes, raised crossings, speed humps, chicanes and roundabouts
- Clear signage and road markings
- Separation of VRUs from motorized traffic
Sophisticated enforcement strategy:
- Using various types of speed cameras (average, mobile, moving and stationary)
- Increasing police visibility, especially on high-risk secondary roads
- Mixing manual and automated enforcement
- Mixing overt and covert enforcement
- Being unpredictable in when, where and how enforcement takes place
Communication:
- Aimed at bridging the perception gap between collective and individual interests
- Launching sustained multimedia campaigns
- Communicate why you are enforcing and implementing infrastructure measures and communicate these results.
- Reframe speeding as risky, socially irresponsible and dangerous.
- Community engagement to foster a culture of shared responsibility
Policy changes:
- Review and lower speed limits especially on central city and residential roads (30 km/h) and secondary roads (80 km/h)
- Standardise road layouts based on the applicable speed regime, or self-explaining roads, a Safe System concept (Source 27), which in turn is related to the function of the road (residential/central city, urban, rural, motorway)
- Monitor speed compliance and the effectiveness of speed management measures and adjust policies accordingly
Addressing the culture of speeding requires confronting cognitive biases, using sophisticated enforcement strategies and technology, reshaping road systems, and reinforcing shared responsibility for safety on our streets.
Speed management is not merely a technical issue—it is a road safety, public health and livability imperative. The science is unequivocal: higher speeds exponentially increase the danger posed to all road users. Reducing speed limits, enforcing compliance, and redesigning road environments can save thousands of lives annually while improving urban livability. When implemented together, these strategies create a self-reinforcing system that reshapes driver behaviour and reduces average network speeds.
Speed management is a cornerstone of road safety, livability and public health. The collective benefits of lower speeds far outweigh the individual convenience of faster travel. Addressing this "tragedy of the commons" requires a systemic approach: infrastructure improvements, rigorous enforcement, and public awareness. By reducing average road network speeds, societies can save thousands of lives and injuries, improve public health, protect VRUs, and create more livable urban environments.
Sources
1 https://www.globalroadsafetyfacility.org/speed-management-hub
2 https://www.un.org/safety-and-security/en/expertise/road-safety
4 https://korkortonline.se/en/theory/reaction-braking-stopping/
5 https://archive.etsc.eu/documents/Speed%20Fact%20Sheet%203.pdf
7 https://www.theorieexamen.nl/auto-theorie/afstand_en_snelheid?lang=english
8 https://www.grsproadsafety.org/wp-content/uploads/2023/05/Speed_management_English.pdf
9 https://etsc.eu/wp-content/uploads/PIN-Flash-36-Reducing-speeding-in-Europe-Final.pdf
11 https://scispace.com/pdf/traffic-safety-dimensions-and-the-power-model-to-describe-e3f1oeykbq.pdf
14 https://swov.nl/en/fact-sheet/speed-and-speed-management
15 https://www.thewisedrive.com/the-myth-of-the-above-average-driver/
18 https://www.wri.org/update/comprehensive-guide-safer-roads-and-livable-cities
19 https://etsc.eu/wp-content/uploads/PIN-Flash-36-Reducing-speeding-in-Europe-Final.pdf
20 https://www.who.int/publications/i/item/managing-speed
24 https://www.transport.govt.nz/statistics-and-insights/safety-annual-statistics/sheet/speed
25 https://swov.nl/en/fact/traffic-enforcement-secondary-road-network-also-policed